![]()
5 Best Business Intelligence Software For All Business Types
Using business intelligence software businesses can gain insights into their customers, operations, and competitors by collecting and analysing data. You can use this information to make informed decisions about where to allocate resources and how to price products and market to potential customers.

There are many reasons why businesses should use business intelligence (BI) software. But the most important reason is that it helps businesses make better decisions.
Businesses can gain insights into their customers, operations, and competitors by collecting and analysing data. You can use this information to make informed decisions about where to allocate resources and how to price products and market to potential customers.
Another reason businesses should use BI software is that it can help them save time and money. By automating data collection and analysis, businesses can free up employees to focus on other tasks.
In addition, it helps businesses improve their relationships with their customers. By understanding their customers better, businesses can provide them with the products and services they want and need.
Therefore, we’ve curated the five best business intelligence software you could use to grow your business and understand how you can run it better.
Table of Contents
Five best business intelligence software for businesses
Microsoft Power BI
With Microsoft Power BI, you get powerful analytics, a user-friendly user interface (UI), and outstanding data visualisation.
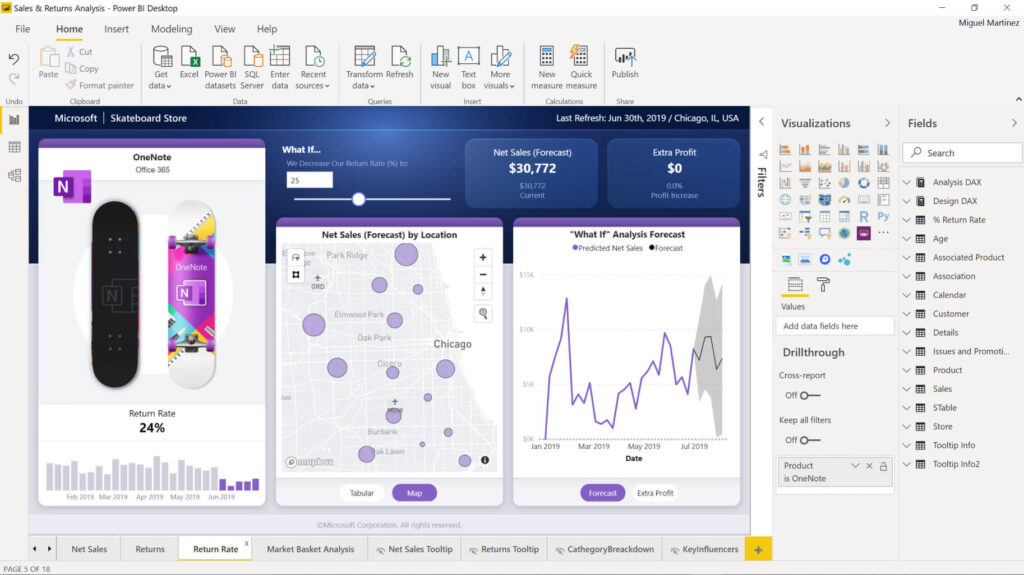
There are 74 data connectors in Microsoft Power BI, which is a record number compared with more mature competitors. Using data connectors, you can connect your BI tool to a particular app or set of data and use that data as a query input.
The Power BI platform also offers downloadable software so that you can run reports either in the cloud or on a reporting server, unlike some of their competitors. In addition, it integrates with Microsoft office tools like Excel and even collects data from IoT devices.
Features
- Attractive Visualisations — Stacked bar chart, Stacked column chart, Clustered bar chart, Clustered column chart, 100% stacked column/bar chart, Line chart, and much more.
- Data Source — Excel, Power BI datasets, Power BI dataflows, SQL Server, MySQL database, Analysis Services, Azure, Text/CSV, Oracle, PDF, Access, XML, JSON.
- Datasets Filtration
- Customisable Dashboards
- Navigation Pane
- Informative Reports
- Natural Language Q & A Question Box
- DAX Data Analysis Function
- Help & Feedback Buttons
- Office 365 App Launcher
- Ad Hoc Reporting
- Ad Hoc Analysis
- Online Analytical Processing (OLAP)
- Trend Indicators
- Interactive Reports Authoring
It offers flexible pricing plans for businesses of all sizes — power BI Pro and Power BI Premium. Check out the pricing plan here.
Drawback
Microsoft Power BI provides no data cleansing solution. Thus, it assumes the data you’re pulling has been prepped well in advance and is of high quality. Therefore, if you need data cleansing capabilities, you may need to find an alternative solution.
Board
Board International integrates three products business intelligence (BI), predictive analytics, and performance management.
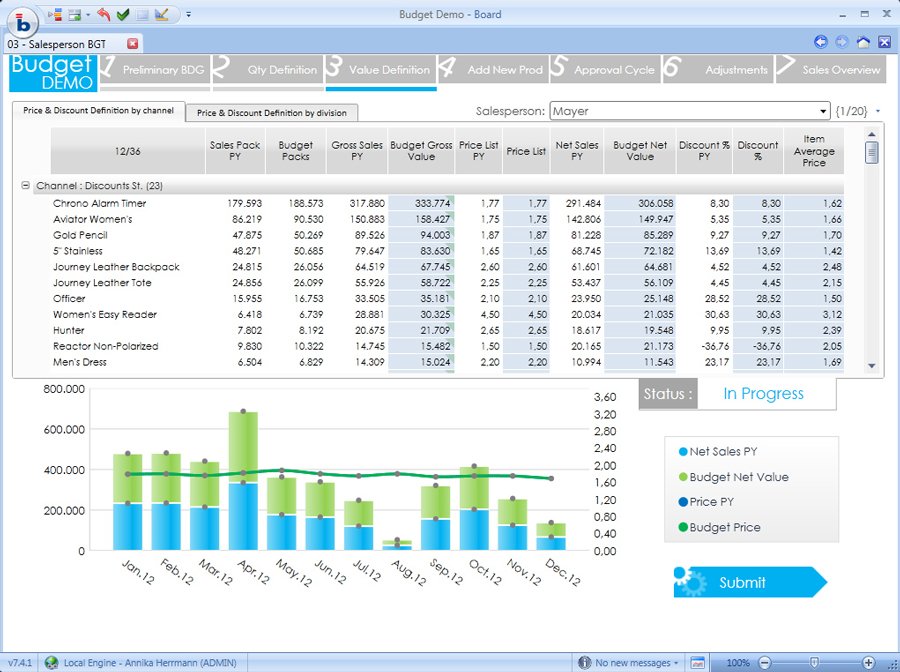
While it strives to provide something for everyone, it mostly concentrates on financial-oriented BI. It includes modules for:
- Finance (planning, consolidation)
- Human resources (skills mapping, workforce planning)
- Marketing (social media analysis, loyalty and retention monitoring)
- Supply chain (delivery optimisation, supplier management)
- Sales (cross-selling and up-selling analysis)
- Information technology (IT) (KPIs, service levels).
The programme is in English, Spanish, Chinese, Japanese, French, German, and Italian. The latest edition of its platform replaces the multidimensional online analytical processing (MOLAP) technique with an in-memory computation engine.
Features:
- Cloud or on-premise
- HBMP
- Granular security
- Server Clustering
- Multi-language
- HTML 5
- A single logical view of corporate data
- Data Connectivity
- Drag and drop analysis
- On-the-fly calculated metrics
- Time awareness
- Drill back to source systems
- Drill through
- Analytical Functions
- Real-time Modeling
- Multi-user concurrent data entry
- Advanced data entry
- ERP database write-back
- Commentary and file attachment
- Workflow
- Business rules
- Scenarios and Versions
- Excel Formula into reports
You can book a free demo here.
Drawback
One disadvantage is the complex implementation of flexible reporting. The reporting standard in BOARD is quite good, but it is very time-consuming.
Tableau Desktop
Tableau Desktop is data visualisation software that allows users to create interactive visual representations of data. It is available for both Windows and Mac operating systems. This BI software will enable users to connect to data sources, including Excel, text files, and databases, and then create visualisations, including charts, graphs, and maps.
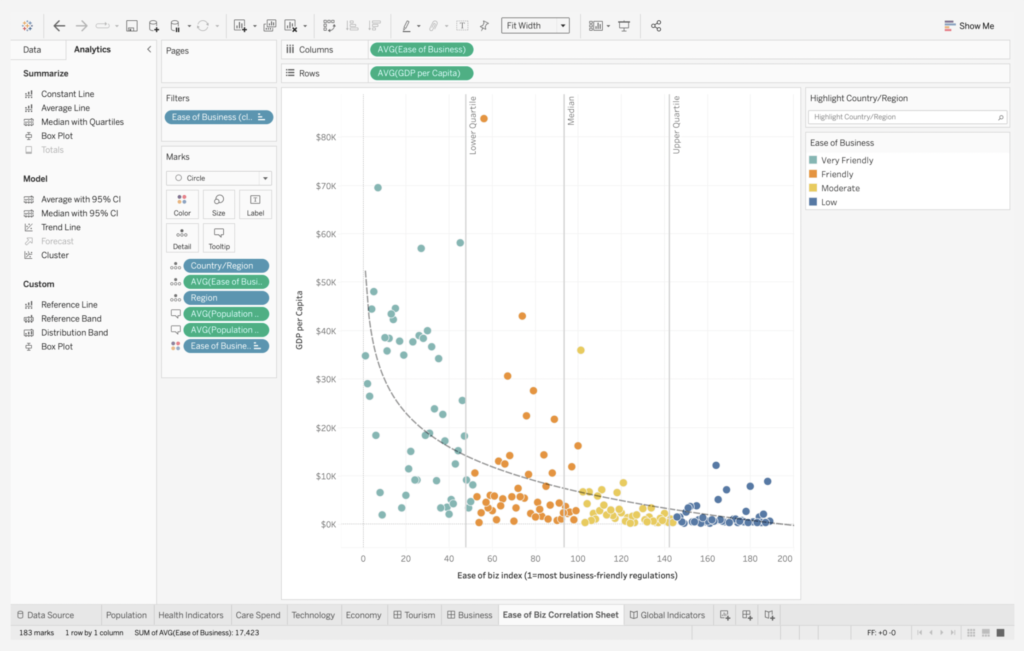
Tableau Desktop also provides various features for customising visualisations, including the ability to add annotations, create filters, and set parameters.
A user-friendly interface with drag-and-drop buttons enables the user to identify trends in the data rapidly.
Features
- Real-time analytics
- Intuitive Dashboard Creation and UX
- Connect to a variety of data sources (and easily integrate with existing technology)
- Role-based permissions
- Simple sharing and collaboration
- Mobile Accessibility
- Querying in natural language with ask for data
- Community support
The pricing plan includes — Tableau Creator, Tableau Explorer, and Tableau Viewer. In addition, you can start your free trial of Tableau without a credit card.
Drawback
To connect to a database from a CSV file or Excel, you still need someone with SQL skills.
Sisense
Sisense is a business intelligence platform that enables organisations to connect to data of any size and complexity and then analyse and visualise it to make better, faster decisions. The platform is powerful enough to handle the most complex data sets yet easy to use.

Features
Organisations today are facing an ever-increasing volume of data coming from a variety of sources. This data is often siloed within different departments or systems, making it difficult to get a holistic view of the business. Sisense breaks down these data silos and enables organisations to connect to all their data, then analyse and visualise it in a single platform.
It includes a drag-and-drop interface, which makes it easy to build dashboards and reports, even for users with no technical expertise. The platform also includes advanced features, such as handling large data sets, creating custom calculations, and integrating with third-party applications.
Sisense is perfect for all organisations, including retail, healthcare, financial services, and manufacturing.
Drawback
- Despite Sisense’s “codeless reporting,” users often need to write SQL code.
- Users cannot consume reports outside the online dashboard because it doesn’t offer scheduled reports through email.
ThoughtSpot
ThoughtSpot BI software is a data analysis and visualisation tool that helps users to gain insights from their data. It offers a range of features that make it easy to work with data, including a drag-and-drop interface, various chart types, and the ability to filter data.
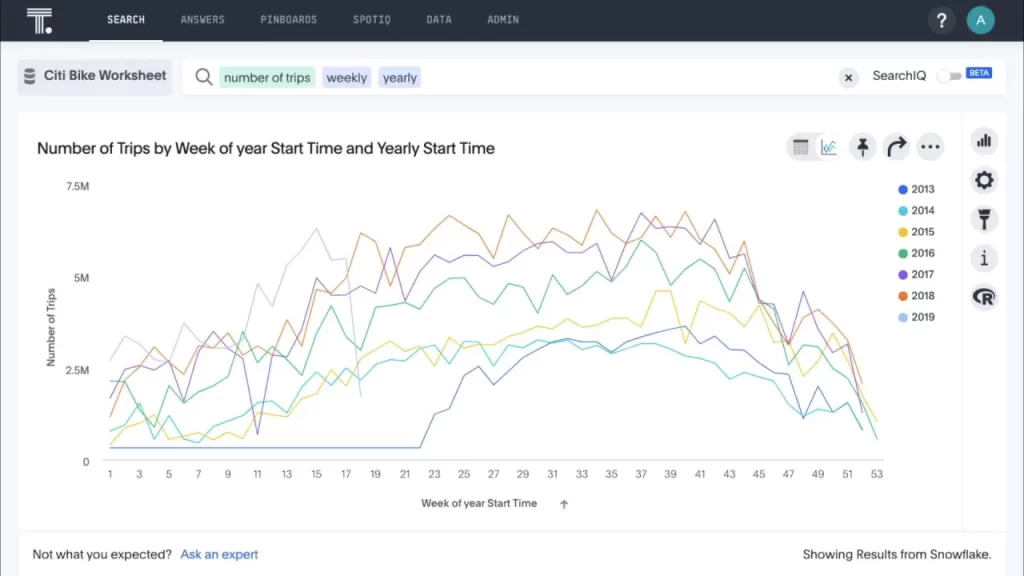
In addition, it also offers several features that make it easy to share insights with others, including the ability to export data to various formats and create custom reports.
Features
The key features of ThoughtSpot include:
- Search-driven analytics allows users to quickly and easily find the data they need
- Artificial intelligence (AI) capabilities help users find and analyse data patterns automatically
- User-friendly interface, which makes it easy for even non-technical users to get started with using the platform
There are four pricing plans — Team, Pro, Enterprise, and Everywhere.
You can also sign up for its free trial.
Drawbacks
- The software can sometimes be quite slow, particularly when working with large data sets. The software is expensive, and the subscription model can be cost-prohibitive for some users.
Key Takeaways
Finding the best Business intelligence tool for your organisation will depend on several factors, including the organisation’s specific needs, available resources, and the decision maker’s preferences. However, here are some tips on choosing the best BI tool.
- Define your organisation’s specific needs and objectives.
- Research the different BI tools available and compare their features.
- Consider the resources available to your organisation, including a budget, staff, and technical expertise.
- Ensure the BI tool you select is compatible with your organisation’s existing systems and data.
- Get input from decision-makers within your organisation to ensure the BI tool you select meets their needs and expectations.
Featured Image is Photo by Anna Nekrashevich on Pexels